Raglan-Indicators Wind Stats
Wind Stats
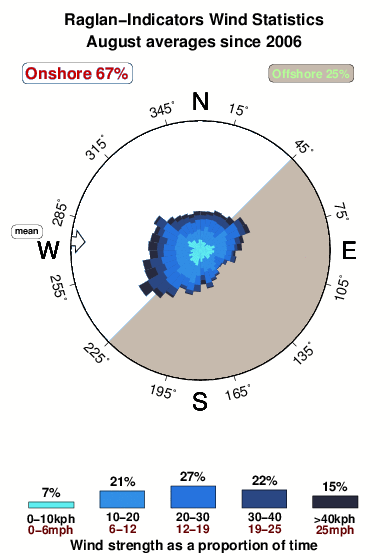


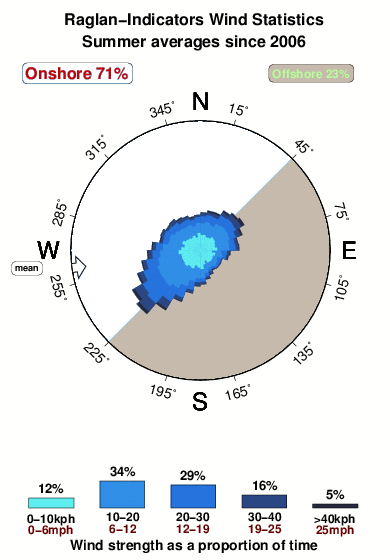
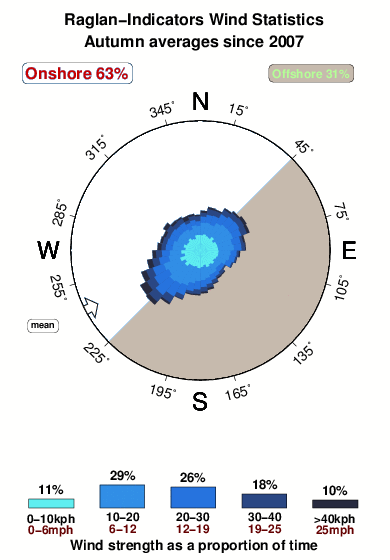
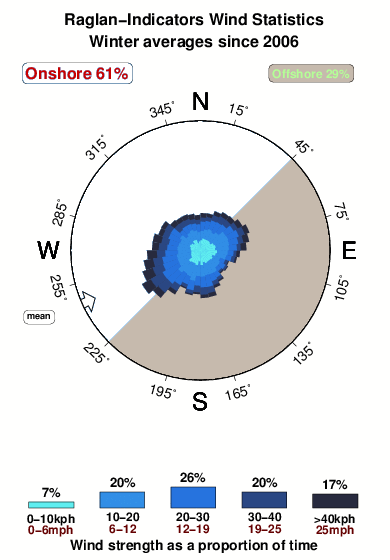
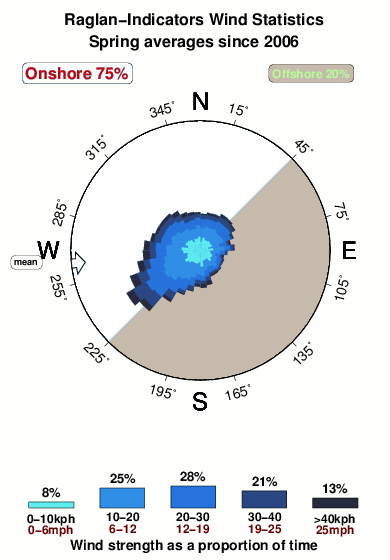
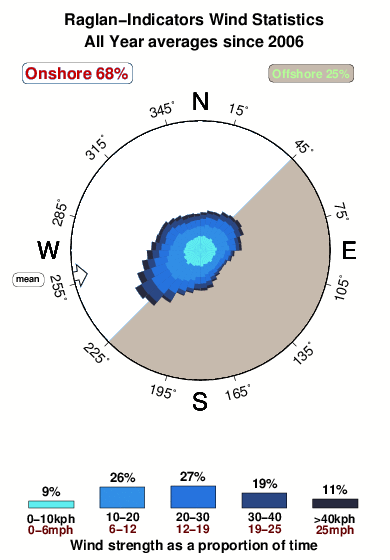
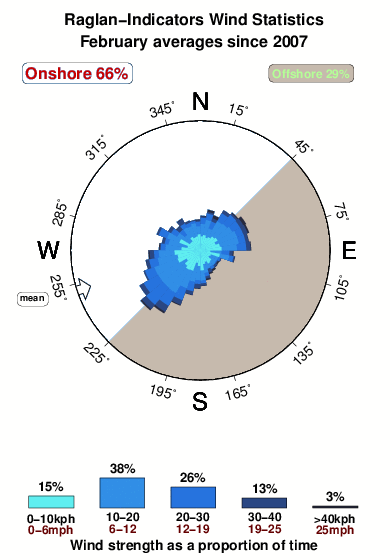
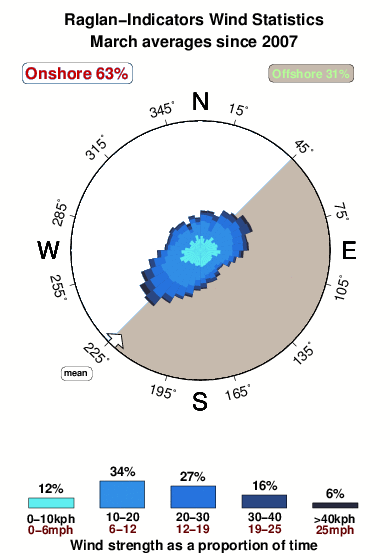
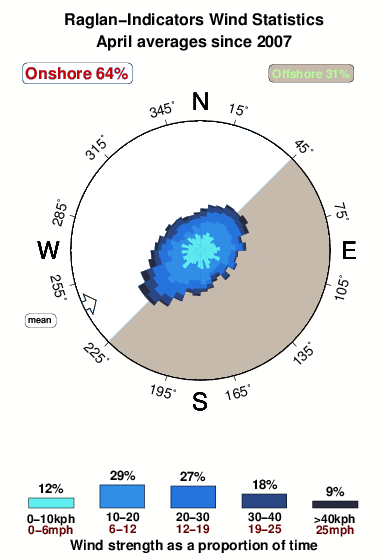
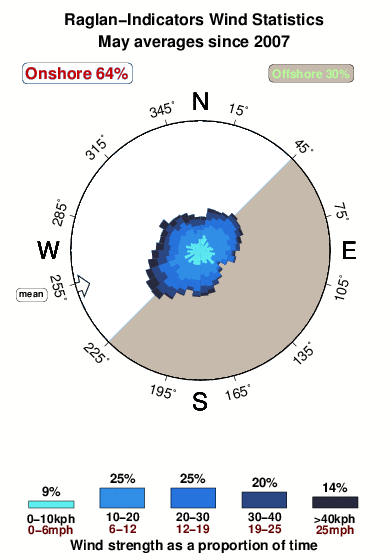
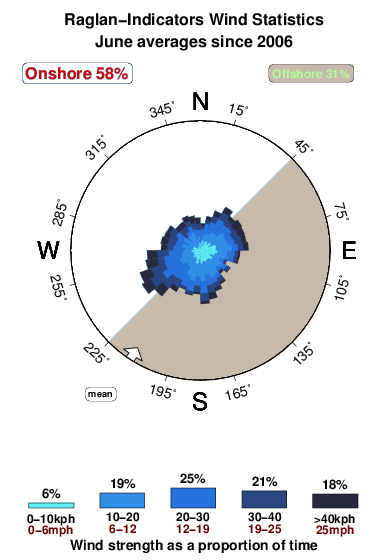
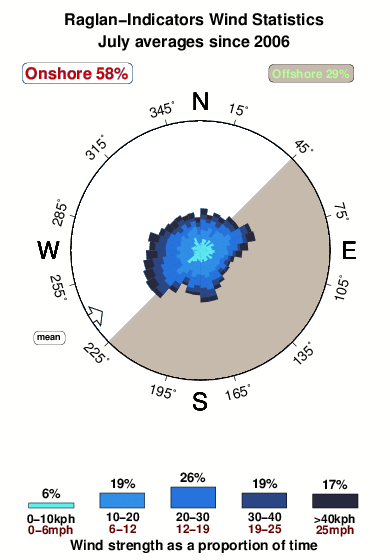
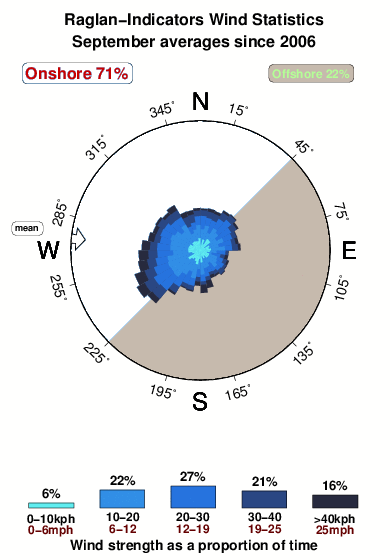
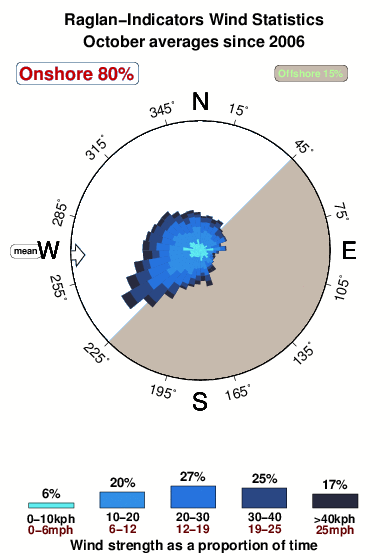
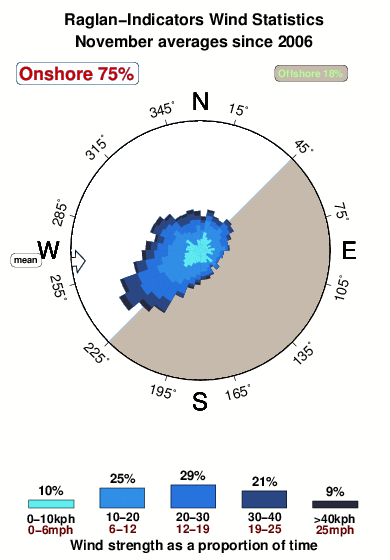
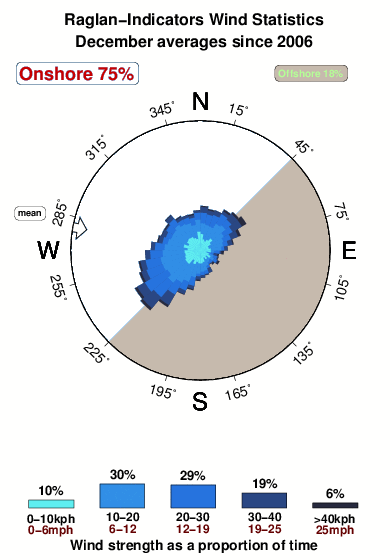
The figure shows how commonly and how strongly the wind blows from different directions over a normal August. The biggest spokes point in the directions the wind most commonly blows from and the shade of blue suggests the strength, with deep blue showing the strongest winds. It is based on 3590 NWW3 forecasts of wind since since 2006, at 3hr intervals, for the closest NWW3 model node to Raglan-Indicators, located 32 km away (20 miles). There are not enough recording stations world wide to use actual wind data. Without question some coastal places have very localized wind effects that would not be predicted by NWW3. According to the model, the dominant wind at Raglan-Indicators blows from the WSW. If the rose diagram shows a close to circular outline, it means there is no strong bias in wind direction at Raglan-Indicators. Converseley, dominant spokes represent favoured directions, and the more deep blue, the stronger the wind. Spokes point in the direction the wind blows from. During a typical August, the model suggests that winds are light enough for the sea to be glassy (pale blue) about 7% of the time (2 days each August) and blows offshore 25% of the time (8 days in an average August). Over an average August winds stronger than >40kph (25mph) are expected on 5 days at Raglan-Indicators
 Nearest